Qlikview Vs Qlik Sense – What Is The Difference Between QlikView and Qlik Sense from Coding compiler. QlikView offers the complete functionality of Business Intelligence, but on the basis of a single platform that does not require the installation of a whole complex of heterogeneous expensive software products, as in the case of traditional BI solutions, and therefore is easy to implement and has a lower cost than traditional OLAP solutions.
Using the development of analytical applications on QlikView, you will never encounter a platform constraint in fulfilling your needs in terms of analytics and data visualization. Almost any visual element can be implemented in QlikView anyway.
Qlikview Vs Qlik Sense
QlikView allows you to quickly build even the most complex models for analysis, effortlessly generate reports on them and keep these models up to date. The ease of working with QlikView and the intuitiveness of the interface make it as user-friendly as possible, and the ease of modification and development ensures the speed and high efficiency of the implementation project.
Qlik Sense is an application for self-visualization, research and monitoring of data. Friendly, intuitive interface does not require special knowledge of data processing from employees. In the finished application, the user only needs to do three actions to create a new diagram without writing codes and formulas. The ability to process data directly in RAM allows you to operate with large amounts of information. Qlik Sense closes the Self-Service BI niche.
At the same time, there is no such freedom in Qlik Sense as in QlikView, the design is fully fixed and it has to be used “as is”. In other words, it is a new, different freedom to do everything you want within the framework of what is. But this offers great advantages for building baseline reports for ordinary unprepared users.
To do this, in Qlik Sense, Drag & Drop functionality is put in the forefront, that is, simply adding objects, dimensions and expressions by dragging and dropping. Such functionality was present in QlikView, but here it is developed to the absolute and becomes almost the main way to build an interface. And easy, beautiful and convenient way.
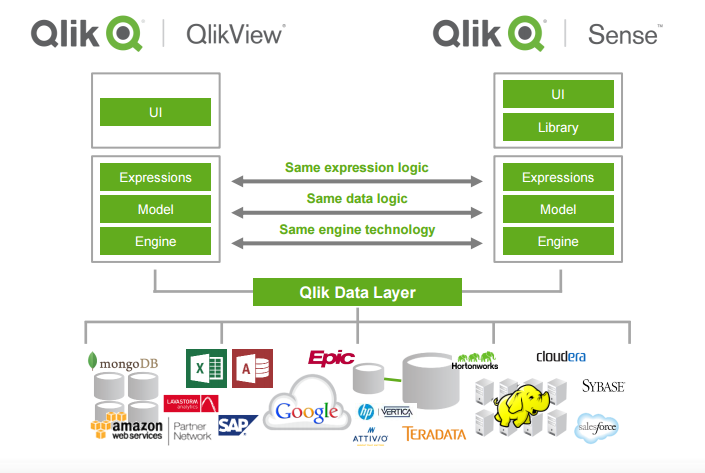
QlikView and Qlik Sense have a different user interface, but almost the same analysis algorithm, which means that the usual scripts and formulas on the QlikView platform work in the same way on the Qlik Sense platform. Scripts from QlikView to Qlik Sense can be transferred by copy-paste altogether.
If you use the terminology of Qlik company itself, then QlikView is intended for “Guided Analytics”, and Qlik Sense – for “Self-service data discovery”.
In other words:
- QlikView is designed for advanced analytical tasks. In this case, the end user has complete freedom to explore the data. Of course, QlikView allows end users to create reports on their own, but in some cases, users do not want to dive into the QlikView environment to create new visualization elements.
- Qlik Sense is fully focused on the business user and allows you to create your own visualization templates in the “drag and drop” mode; choosing ready-made indicators from the library makes it easy to develop your own data histories.
Both systems are compatible with heterogeneous data sources and allow making both generalized analyzes and expanding the selection down to specific problem transactions and immediately draw conclusions on the current situation in the company.
To summarize the purpose of the two products, then, QlikView is designed for advanced analytical tasks. In this case, the end user has complete freedom to explore the data. In QlikView, of course, you can create analytical reports, but QlikSense greatly simplifies this task and allows you to create your own visualization elements faster and more variably.
From the point of view of the depth of analytics, there are no differences, but with the simplicity of building analytical applications – Qlik Sense is a real assistant to a data explorer.
In Qlik Sense, the “Main Elements” tab contains all types of visualizations, which are easily dragged onto the working area of the sheet, thus, you are already adding a new visualization ie Many options are optimized to drag-and-drop. Qlik Sense samples work with the Global Selectors feature, i.e. the system itself colors and selects fields for the application.
In QlikView, on the scatter diagrams, only the square selection element was available for selection, and Qlik Sense has an excellent solution — Lasso, which customizes and simplifies data sampling during data mining.
Qlik Sense can load data not only with the help of a script like in QlikView, but also drag-and-drop the file into the quick loading section – very convenient for Excel files. Web File Connections allows you to download data from the Internet – simply, quickly and in the spirit of the times. Visualization and dashboards in Qlik Sense have become even clearer and more beautiful.
Applications really and comfortable and stylish look. You can change the colors of the visuals and watch the previews of the developed panels. What else is nice is a fast geoanalyst connected to the OpenStreetMap module.
If there is a need to exchange data with colleagues, you can publish your dashboard to the Qlik Sense server or in the Qlik Cloud cloud (available for the free version of Qlik Sense for 1 GB, with a maximum application volume in the cloud – 25 MB).
We, as experts in BI, are very impressed by Qlik Sense as a convenient, simple and inexpensive tool for a business user. It easily solves the problem of creating attractive visualizations on the fly with the help of built-in data libraries and data histories, with a drag-and-drop function and an abundance of visuals.
Thus, the main functional differences (from the point of view of the final, unprepared user) QlikView from Qlik Sense are the possibilities of visual presentation of analytical data.
The key difference is in positioning: QlikView is positioned as a corporate platform, and Qlik Sense is positioned as a tool for personal end-user data exploration.
In this table, we tried to reduce and compare the main differences of QlikView from Qlik Sense in terms of visualization capabilities.
QlikView vs Qlik Sense Comparison – Features, Support, and Pricing
| No | Visualization | QlikView | Qlik Sense |
| General Features | |||
| 1 | Technology | Thick client and ajax for web views | html5 |
| 2 | Auto scaling | Not | Yes |
| 3 | Navigation | Navigation implementation may be arbitrary: · By sheets · button (in this case the sheets can be hidden) · By selection (e.g., selection from the list of a particular SAC may lead to switching on the tab selected SAC cards) · can be configured on any object (directly with the level of object properties or imitation through the imposition of a text object) switching to a tab with the use of certain filters · To switch between tabs, you can configure certain filtering operations or removing filters |
The implementation of navigation is strictly predetermined: · By sheets |
| 4 | Object management in the workspace | · Objects can be placed in any order, the position of objects can be controlled up to 1 pt. · Objects can be superimposed on each other, for example, to implement non-standard visualization, which can only be represented as a combination of objects · The size of an object can be controlled up to 1 pt. |
· The position of objects is strictly tied to the grid of the working space – the minimum step is the grid cell · Object overlapping is impossible · The size of the object is also tied to the grid of the working space – the minimum step is the grid cell |
| 5 | Glossaries | Absent | · You can create your own analytics glossary · You can create your own glossary of indicators · You can create your own glossary of visualizations |
| 6 | Variables | There are tools for forming variables at the interface level. This allows you to further use them in setting up sliders, setting up actions that buttons or text objects can perform. |
There are tools for forming variables at the interface level. They can be used only in any formulas, action settings at the level of text objects are not present, there are no sliders in the standard visualization set. |
| 7 | Expressions | A wide range of functions that can be used for various calculations. Built-in wizard allows you to select any function and see the syntax of its writing | A wide range of functions that can be used for various calculations. Built-in wizard is almost absent |
| 8 | Visualization objects | Tabs, charts, text objects, tables, pivot tables, buttons, lines, calendar / slider, container | Tabs, charts, text objects, tables, pivot tables |
| 9 | Parameter Sets for Customizing Visualization | For each type of object (diagram), there can be defined 13 groups of settings (general, measurements, limits of measurement, expressions, sorting, style, axis representation, colors, number, font, layout, title) In each group, 5 to 30 can be defined parameters |
For each type of object (diagram), 4 groups of settings can be defined (data, sorting, additions, type). From 1 to 5-7 parameters can be defined in each group |
| 10 | Triggers | QlikView has the ability to customize triggers (additional events) that can be performed and initiate certain actions to accomplish certain conditions. For example, we form a trigger to choose from in the project list – the trigger executes and switches us to the project card tab. Cleared the list – another trigger works and returns us to the list of projects | Missing |
| 11 | Creating new objects | Copy and modify existing, create new using wizard | Copy and modification of the existing, creating a new one using drug & drop |
| 12 | User Interactivity | Arbitrary sampling through the selection of the area Pie charts do not have additional.Interactive In the bubble diagram, the selection can be made using the selection area |
Arbitrary samples through the lasso tool. Pie charts can be scrolled using the mouse wheel. In the bubble chart, you can make a selection by selecting the range along the x axis and y axis. |
| Solving specific visualization tasks | |||
| 13 | Chart Sensors | · Several (7) diagram types are supported. · In each diagram, you can add an unlimited number of text comments if necessary. · You can control the parameters of a particular selected style (choice of arrow type, definition of cylinder thickness, coverage angle) |
· 2 types of diagrams are supported · In each diagram, you can add 2 text comments (as a subtitle and as a footnote) · There is no control over the parameters of a particular selected style (choice of arrow type, definition of cylinder thickness, coverage angle) |
| 14 | Charts: line graphs, histograms, combination diagrams, pie charts, block diagrams | · For each chart can be configured to quickly switch from one type of chart to another; · For each chart, you can set the measurement limits – allows you to display TOP 10, 15, etc. positions, manage a set of positions in the TOP through the slider · Each chart has its own set of styles that can be used for visualization · In case additional is required. signals or indicators on the chart, then you can add text objects or build a graphic substrate that will reflect these indicators · You can implement a “what if” analysis using standard tools |
· The number of styles is limited, as a rule, by 2 views. At the same time, for some diagrams, this is control of the position of the diagram, rather than the style. · Implementation is possible using extension objects to create sliders. |
| 15 | Visualization using charts funnel, mecco, grid, radar | Present in standard functionality | Missing |
| 16 | Cyclic groups and drill down groups | · You can set up a cyclical group that will switch the graph between different measurements, for example, reflect the revenue structure in a pie chart, first by region, then by business, then by CFA · You can set up a Drill Down group for consistent data drill down |
· Cyclic groups are absent · You can set up a Drill Down group for consistent data drill-down. |
| 17 | Color management | You can control the colors of fonts, borders, cells, diagram elements (sectors, bars, lines, points, etc.) up to specifying a specific RGB for a particular analytics or writing the conditions under which one and the same sign can take one or another color . Below is an example of color management for graphic elements, but in addition to this, you can control the colors on the tabs: common for headings, expressions for the background or text expressions / dimensions, axes for the color of the axis or text on the axis, etc. | Color management options are limited. You can set the use of colors by measurement, measure, expression. But you can set a specific color through RGB only in the expression |
| 18 | Font Management | Present at the document level as a whole, at the object level, at the level of elements of the visualization object | Missing |
| 19 | Comparison groups | You can create different groups – this functionality allows you to bind certain filter groups to certain groups, which allows for comparative analysis | At the property level model, such a setting is missing. It can be realized only through the creation of a second data branch within one model to ensure such a comparison. |
| 20 | Language switching | It is implemented through standard objects: buttons and sets of variables that are responsible for changing label languages, as well as by creating copies of objects that are hidden / displayed when choosing one or another interface language | It is possible to implement an object through the extension that will be controlled by setting the interface language parameter How it will be necessary to implement the logic of the objects will need to think |
| Licensing and cost | |||
| 21 | Licensing and cost | There are several types of server licenses: Enterprise Edition Server – designed to work in large organizations or to solve complex problems with a large amount of data processed. There are also 2 main types of user licensing: • Named User License – a named user, without restrictions on the number of documents • Document License – user / document access when the user has access to a limited number of documents • There is also a free version (Personal Edition) • Also for large installations or for the convenience of working with user roles, Publisher is desirable for pre-slicing the application in accordance with the access rights or grouping of applications, for example, by the level of detail. |
Qlik Sense – licensed per token. More precisely, the order of licensing can be found here in the License Terms . |
Difference Between Qlikview And Qlik Sense
QLIKVIEW DIFFERENCES
QlikView is the industry’s most advanced Business Intelligence system. Unlike traditional OLAP cubes, QlikView uses the new generation InMemory technology, which gives users unprecedented speed of working with data.
The second difference from OLAP-cubes is used by associative data models, which provides an incredibly easy implementation of various data operations and virtually unlimited possibilities for analytics.
QlikView is the first business intelligence system with in-memory data processing. The system loads into RAM all the data needed for analysis, and therefore users can work with them, getting an instant response.
User-requested aggregated data is calculated and returned with zero delay. To ensure this speed, QlikView algorithms compress data up to 10% of the original volume. As a result, the QlikView platform can scale and process very large datasets without requiring additional hardware investments.
The same basic technology QlikView provides automatic processing and support for all associative links in the data. As a result, neither users nor developers need to worry about managing associations and spending a significant amount of resources on their manual coding.
This allows users to not be limited to specific reports, predefined transitions between different levels of detail, or using pre-configured dashboards. Instead, they can move up, down, and sideways, exploring them from any direction they want.
QLIK SENSE DIFFERENCES
Qlik Sense is a drag-and-drop data visualization and research platform that can satisfy most business intelligence requirements, in addition to super-heavy production reporting. It provides an easy-to-use interface suitable for any skill level, and has a large share of built-in artificial intelligence to help users.
Charts, tables and dashboards – its basic tools, for almost any level of complexity or simplicity. Users can share their visualizations with the help of various mechanisms and platforms for mobile access, on any device (visualizations work in HTML5).
Pros: Very clever data structuring for analytical purposes.
Cons: They are not, but I would like more computational analytics capabilities.
A very important feature of QlikSense is extensibility. Perhaps this is not the most attractive feature, but it distinguishes adult products from children in the world of corporate business intelligence.
In fact, QlikSense is one big extension built on itself! A large number of APIs are available for embedding visualizations in projected applications, creating custom connectors and building new types of visualizations.
Developers will not have any problems with the QlikSense extension, if necessary. Finally, QlikSense is quick, this is guaranteed by its associative in-memory engine.
Perhaps the most significant difference between QlikSense is the associative data processing engine. He understands the connections between different data sources and may offer previously unrecognizable relationships. Many vendors use the term data discovery, but this feature gives this expression a new meaning.
The program comes in two versions. QlikSense Desktop is free to download and not limited in any way. It runs on a Windows PC and is able to work with a variety of data sources.
QlikSense, as a platform, runs on a server (s) and provides users with a browser interface. Both options have similar functionality, but the server platform can serve globally distributed enterprises with its excellent scalability and distributed architecture.
Qlik always offers an excellent management system for its environment, and IT personnel have the tools to check the integrity and uniqueness of data and provide secure access to them.
QlikSense does not come with any advanced statistical or predictive analytics, but this is not its area.
Qlik Sense is ideal for organizations that need easy-to-use tools for visualizing and researching data, but may also need additional capabilities to solve more complex tasks.
This is a corporate solution with its management system and developer support capabilities. Companies that are looking for a platform for corporate reporting (invoices, etc.) should look somewhere else, because users who need a few simple diagrams will find QlikSense too overloaded.
Hi there to every , since I am in fact eager of reading this weblog’s post to be updated daily.
It consists of good stuff.